Create Stunning Bar Graphs with Jimni Nomics
Curl to PHP SCSS to SASS Delimited Text Extractor STYLUS to SASS JavaScript Validator Text Cleaner JSON to String CSS Beautifier & Minifier Avro Formatter Hex to Binary ROT13 to Text Whirlpool Hash Generator Flag Maker Text to HTML Converter Perl Formatter UTF-8 Converter Inches to Pixels Converter MD4 Hash Generator Pantone to RGB JSONify String Unstringify JSON PUG to HTML JSON Navigator CSS Border Radius Generator String to Binary Octal to HexaDecimal SVG Viewer Random AlphaNumeric Generator Random Binary Generator Hex to UTF8 HTML URL Input Generator Round Corners Images Online Crontab Generator Random Integer Generator HTML Table Generator Bitwise Calculator Full Blue Screen JPG to PNG Converter Lua Beautifier MD5 Hash Generator SQL Table Generator JSON Viewer alleditor To-Do List Application HTML Color Input Generator Length Converter PNG to Base64 Converter Fake Tweet Generator Sort XML Online SOAP Formatter
Digital Seo tools

Transform Your Workflow with Jimni Nomics' Innovative Tools

At Jimni Nomics, we provide a suite of powerful tools designed to streamline your business processes and boost productivity. From cutting-edge software solutions to user-friendly applications, our tools are crafted to help you work smarter, not harder. Explore our range of features and see how we can transform your workflow today.


50%

Bar Graph Maker

Welcome to Jimni Nomics, your go-to tool for creating visually appealing bar graphs that simplify data representation. Whether you need to compare business data or analyze trends, our bar graph maker enables you to present information clearly and effectively


Types of Bar Graphs


There are several types of bar graphs that you can create using Jimni Nomics' Bar Graph Maker. These include:

  • Vertical Bar Graphs: Represent data vertically with bars rising along the y-axis.
  • Horizontal Bar Graphs: Display data horizontally with bars extending along the x-axis.
  • Stacked Bar Graphs: Show parts of a whole with each bar divided into different colored segments for easy identification.
  • Grouped Bar Graphs: Useful for comparing multiple categories with bars grouped together by category.

How to Make a Bar Graph


Creating a bar graph with Jimni Nomics' Bar Graph Maker is simple. Follow these steps:

  1. Enter your data, whether it's sales figures, survey results, or any other dataset.
  2. Choose your preferred graph type: vertical, horizontal, grouped, or stacked.
  3. Label the axes, set a title, and customize the graph to your needs.
  4. Generate your graph and download or share it as needed.

Why Use Bar Graphs?


Bar graphs are one of the most widely used methods of data representation. They allow for quick comparison between different data categories, making them an essential tool for business, education, and research. Whether you need to track sales trends or visualize survey results, bar graphs make data analysis more intuitive and accessible.

Key Features of Bar Graphs


Some key elements that make bar graphs unique include:

  • Equal width and spacing of rectangular bars.
  • Bars can be oriented vertically or horizontally.
  • Clear representation of independent data categories without confusion.
Recent News

Check Our Blog Posts

The Secret Weapon to Boost Your Digital Presence: Graphic Design
Graphic 05 June 2025

The Secret Weapon to Boost Your Digital Presence: Graphic Design

In today’s digital age, having a strong online presence is crucial for businesses of all sizes. Whether you’re a startup or a well-established company, the way you present yourself online can make or break your success. While many businesses focus he

Jimni NomicsBy: Jimni Nomics
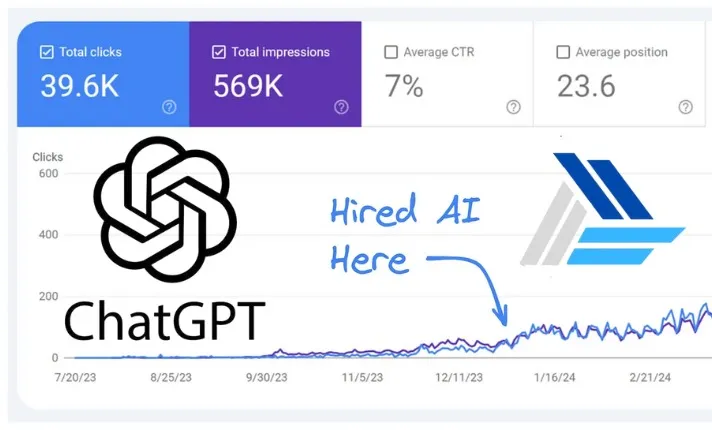
AI Is Running My SEO Blog. Here’s the Growth So Far
AI 05 June 2025

AI Is Running My SEO Blog. Here’s the Growth So Far

At Jimni Nomics, we recently launched a new initiative to drive organic traffic through SEO-focused blog posts. After thorough research, planning, and setting up our website, the next challenge was attracting visitors. Leveraging my knowledge of SEO,

Uncover the Secret Tools I Use to Boost SEO Rankings
Seo 05 June 2025

Uncover the Secret Tools I Use to Boost SEO Rankings

Achieving high rankings on search engine results pages (SERPs) requires more than just great content. It involves a combination of strategy, analysis, and leveraging the right tools. As someone who has spent years optimizing websites, I’ve tested num

How I Structure and Write SEO Optimized Articles in 2024
SEO 05 June 2025

How I Structure and Write SEO Optimized Articles in 2024

SEO has evolved far beyond simply stuffing articles with keywords. In 2024, I focus on entities, semantics, and creating content that demonstrates real expertise, especially after Google’s September 2023 Helpful Content Update. This approach has sign